PART 1 · Fundamentals
Knowing the Redhat system
Redhat is a chart-reading assistant that brings several internationally standard TA disciplines together on a single screen — signals, Fibonacci, Elliott, Gold Meter and Dashboard all live in one chart view, letting you read direction, find entries and manage risk yourself, with a constant reminder that every signal is a projection, never a guaranteed answer
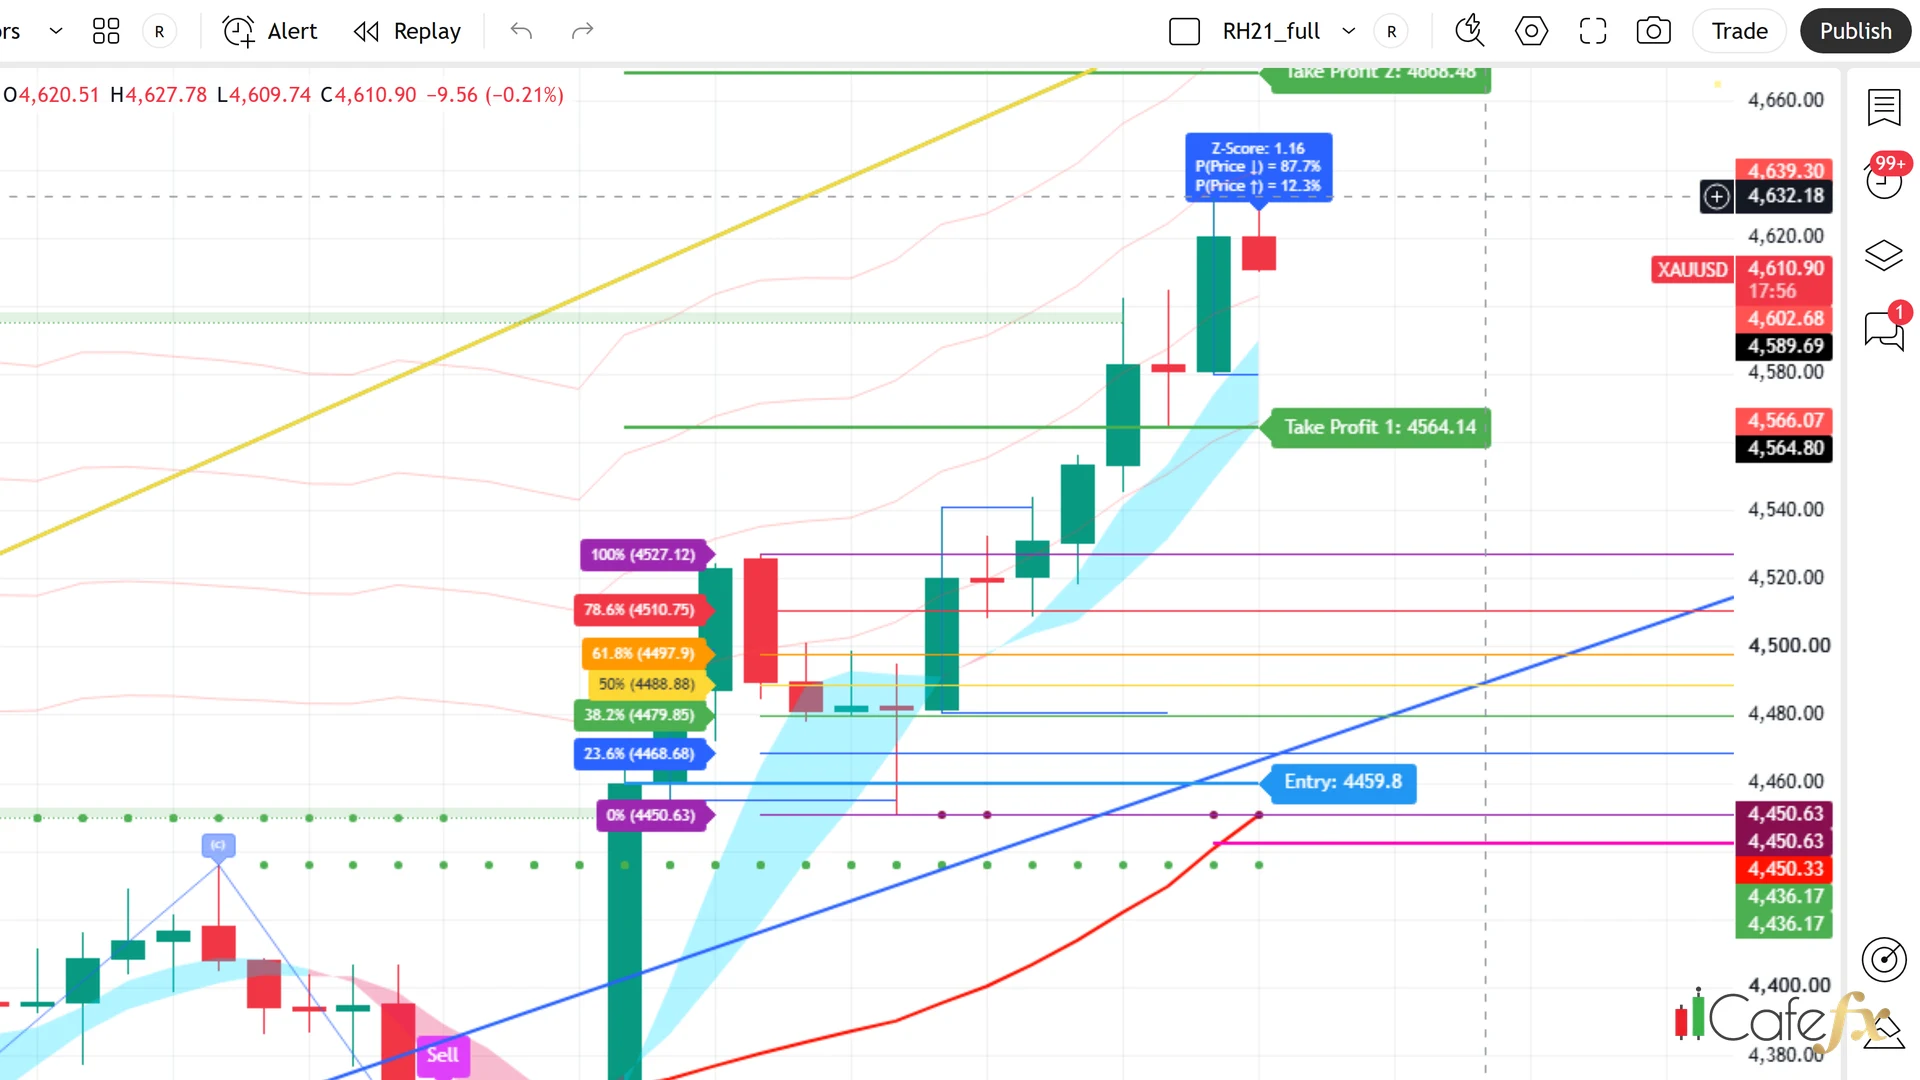
Chapter summary video
Real chart screen recording · not investment advice
Listen to the TL;DR summary of this chapter
TL;DR
Redhat is a chart-reading helper, not a robot that places orders for you — it gathers internationally standard TA tools into one screen and helps you read direction · find entries · manage risk, and every signal it draws is a projection that you must cross-check against other tools before deciding
1 · What Redhat really is
Redhat is a toolkit panel that puts several internationally standard chart-analysis disciplines on one screen — Fibonacci, Elliott Wave, liquidity zones, trading sessions, Gold Meter and many more that normally have to be opened one at a time are now visible together on a single chart
Important: it is not a bot that enters orders for you, and it is not a "profit guaranteed" tool — it simply organizes information so it is easy to read; the decision is yours
Redhat = a chart-reading assistant that gathers internationally standard TA into one screen so you can decide yourself — it is not a trading robot
2 · It helps you with 3 things
Redhat splits the messy work of trading into 3 clear steps you handle one at a time, so you do not have to stare at charts all day
- Read direction — is the market trending up, trending down, or going sideways? Answer it with the Range Filter and Trend Ribbon
- Find entries — when a major signal fires, it draws Entry, Stop Loss and Take Profit 1/2/3 on the chart for you
- Manage risk — SL is fixed by the ATR(14) × 1.5 formula and TPs sit at 1R/2R/3R, so you know the risk and the reward multiple before you enter
Memorize these 3 things and half of your trading already has a system — most people who fail do not lose to the market, they lose to entering at the wrong moment without a cut-off point
"No matter how powerful a tool is, if you use it without thinking the result is no different from gambling — Redhat helps you see the data, but the final call is still yours"
3 · The honest scope: it assists decisions, it does not auto-trade
Said plainly from chapter one: Redhat is a decision-support tool, not something that places orders for you — it draws signals and Entry/SL/TP levels on the chart, but it never clicks buy or sell on your behalf
And most important of all: every signal it draws is a projection (estimate) for that timeframe, not a 100%-certain answer — price may never reach the TP
The right way to use it = take the drawn signals and cross-check them with other tools before entering — market structure, Elliott, Fibonacci and Gold Meter should agree on several levels before you trust the setup; never enter just because a signal appeared
4 · How to read this manual
This manual is divided into 4 parts, ordered from easy to hard. You can read in order or jump to the chapter you want, but going through from the start is recommended
By the end you should be able to find entries on your own, not follow signals blindly — chapter 8 is the summit: a 5-step entry process you can run yourself
This chapter in one line
Redhat = a panel of internationally standard TA tools on one screen that helps you read direction, find entries and manage risk — but every signal is a projection, and you make the decision