PART 2 · Tools
Using Redhat to view the Dashboard
The Dashboard is the Final Vote — it condenses SMC liquidity into a percentage: ≥65% strong Buy, ≤35% strong Sell, but you use it as a supporting vote, not the only voice
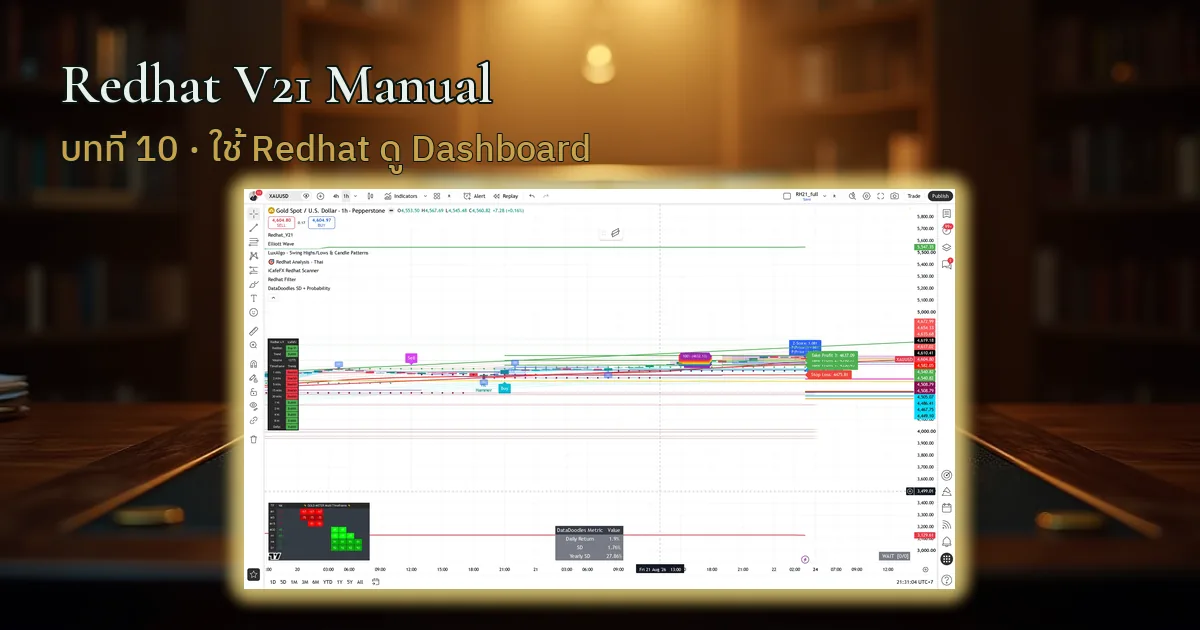
Chapter summary video
Real chart screen recording · not investment advice
Listen to the TL;DR summary of this chapter
TL;DR
The Dashboard is the panel that condenses SMC liquidity into a percentage — ≥65% = strong Buy, ≤35% = strong Sell; use it as the Final Vote, not the only voice
1 · What the Dashboard is
The Dashboard is the panel that rolls SMC-style liquidity (Smart Money Concept) into a single percentage — it tells you how many percent of the SMC tools currently agree on a direction
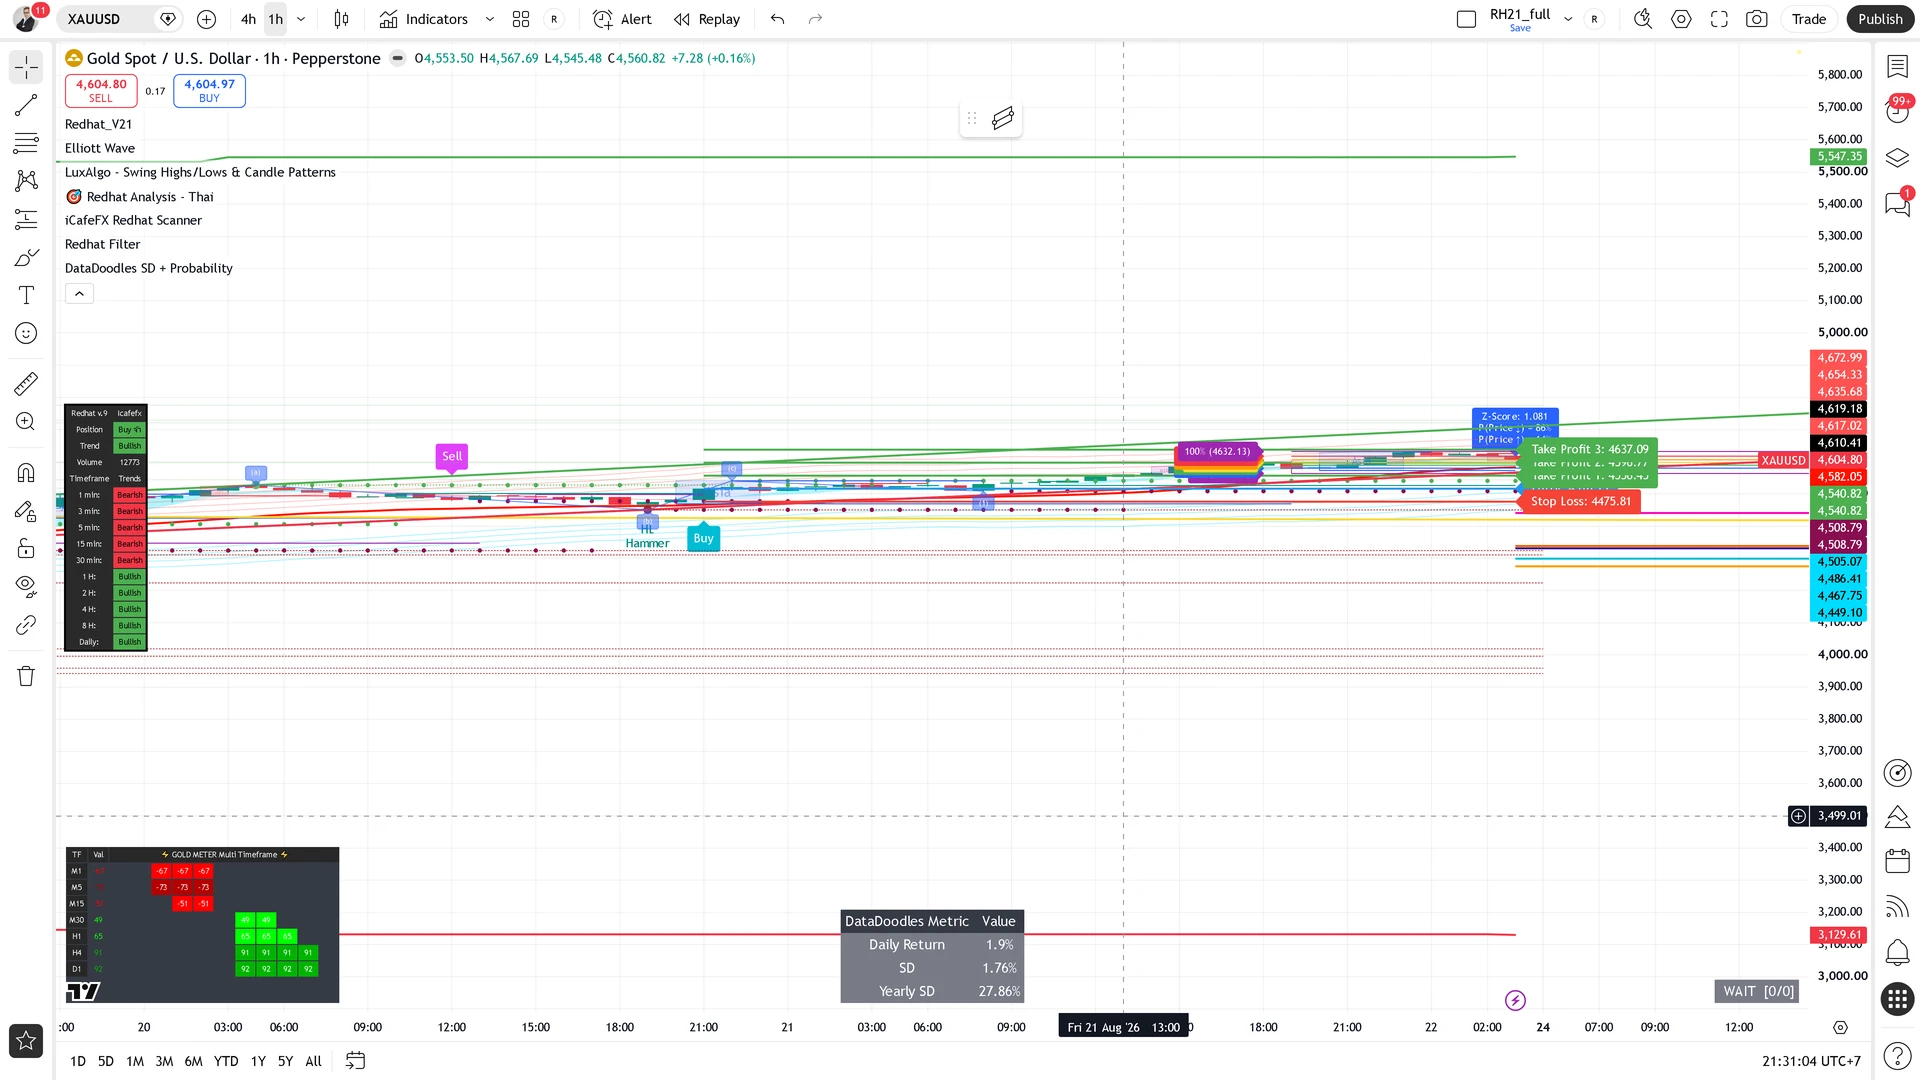
Flip on the Dashboard switch in Redhat and the panel appears on the chart
Dashboard = the SMC summary panel as a percentage, the Final Vote
2 · How to read the Dashboard
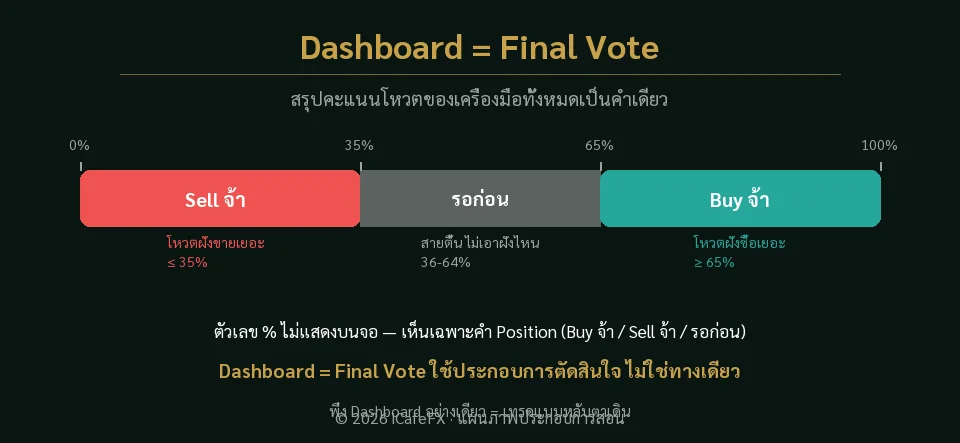
The fixed reading rule: ≥65% = strong Buy (bullish) / ≤35% = strong Sell (bearish) / the middle 35-65% = neutral, wait
Where to look: on the chart you see the Dashboard panel's Position box show the words "strong Buy" / "strong Sell" / "wait for the moment" — the 65%/35% numbers are internal logic the system uses to compute that word; you never see the 65% figure on screen, only the resulting word in the Position box
≥65% strong Buy = bullish / ≤35% strong Sell = bearish / the 35-65% middle = wait, do not be confident yet
3 · How to use the Dashboard
The Dashboard is the Final Vote, not the only voice — combine it with the other tools: direction from the Range Filter, levels from Fib/Elliott, strength from the Gold Meter, then the Dashboard casts the confirming vote
- Look — does the status word read "strong Buy" or "strong Sell" (the 65/35 numbers are internal logic, not shown on screen)
- Check — do the other tools agree
- Use — the Dashboard is the Final Vote, not the only voice
"The Dashboard is the Final Vote, not the sole verdict — use it together with the other tools"
This chapter in one line
Dashboard = the SMC summary panel — ≥65% Buy, ≤35% Sell; it is the Final Vote, not the only voice, so use it together with the other tools