PART 3 · Signals
Entry/SL/TP
Entry/SL/TP = per-timeframe estimates Entry = the close of the reversal candle, SL = ATR×1.5, TP = 1R·2R·3R — use them together with confluence
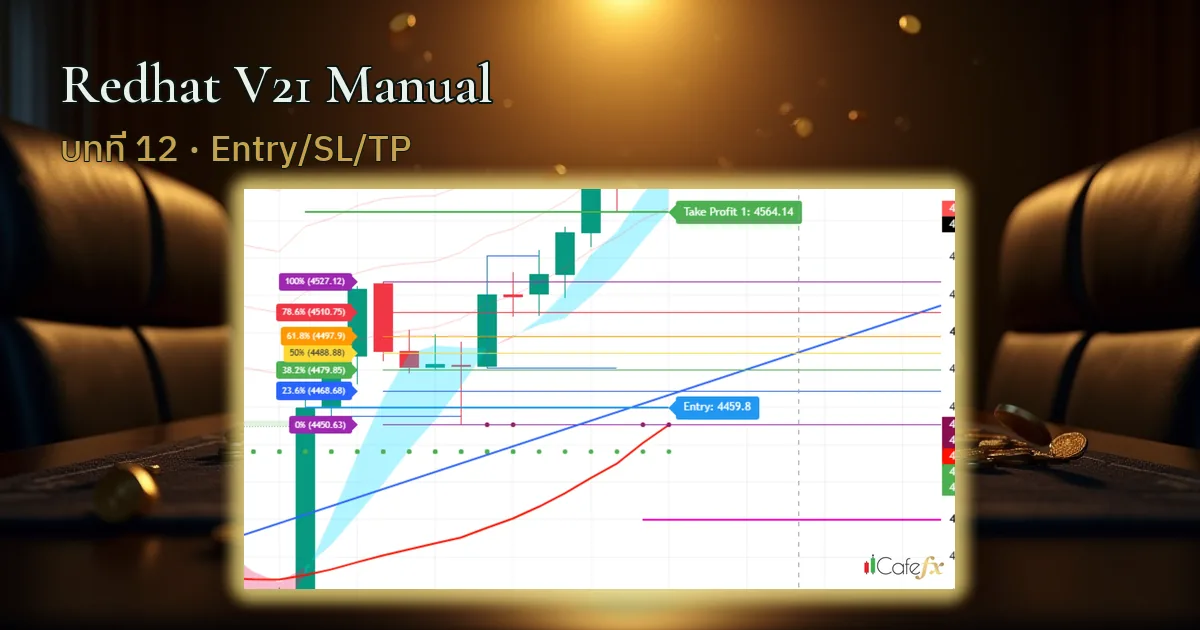
Chapter summary video
Real chart screen recording · not investment advice
Listen to the TL;DR summary of this chapter
TL;DR
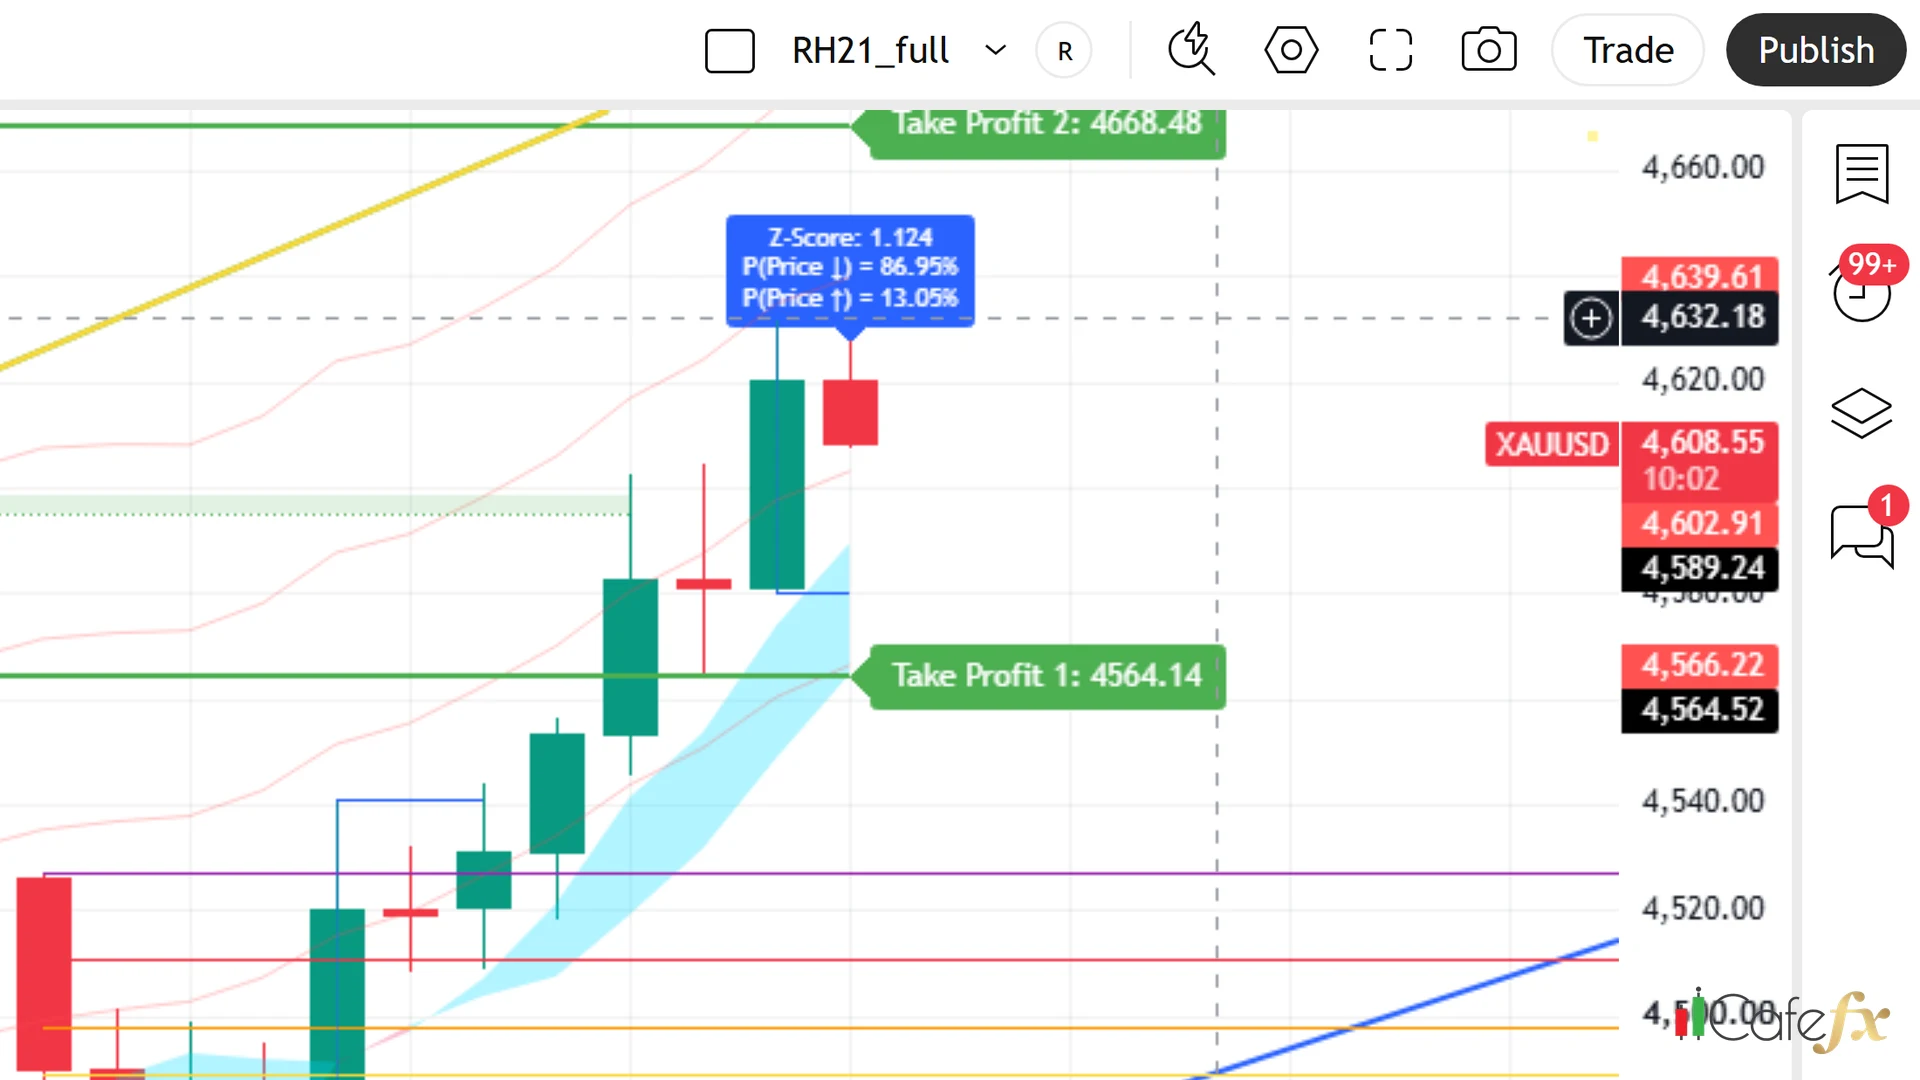
Entry = the close of the candle where the Range Filter flips / SL = fixed ATR(14)×1.5 / TP = 1R·2R·3R — all three are estimates and must be used together with confluence
1 · What Entry is
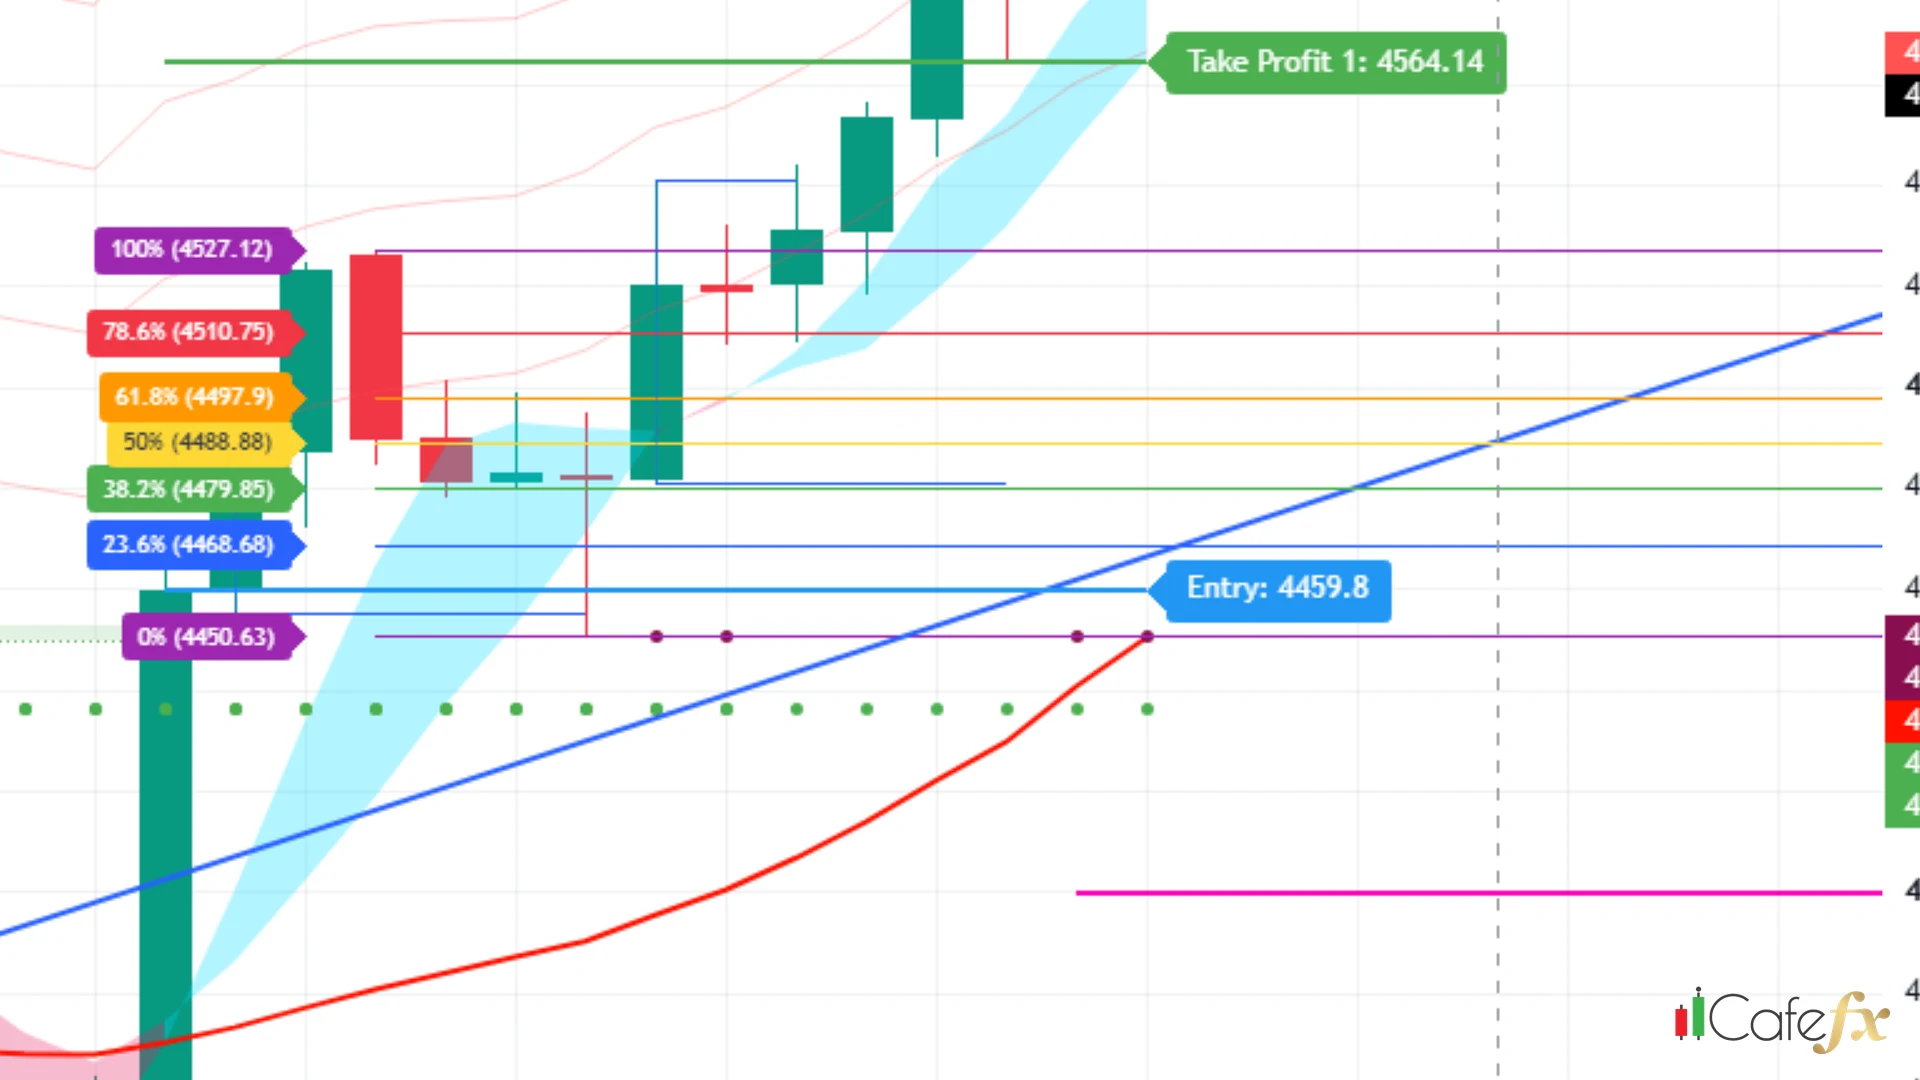
Entry = the closing price of the candle where the Range Filter flips direction — Redhat draws the Entry line on the chart so you can see it clearly, no guessing needed
2 · Entry ≠ Fib 0% ≠ Elliott
On the chart Entry + Fib 0% + the Elliott start point (1) usually sit very close together — but they are three different things, so do not confuse them:
- Entry — the close of the reversal candle (from the Range Filter)
- Fib 0% — the starting point of the Fibonacci lines (from the Fib tool)
- Elliott (1) — the start of the Elliott wave (from the Elliott tool)
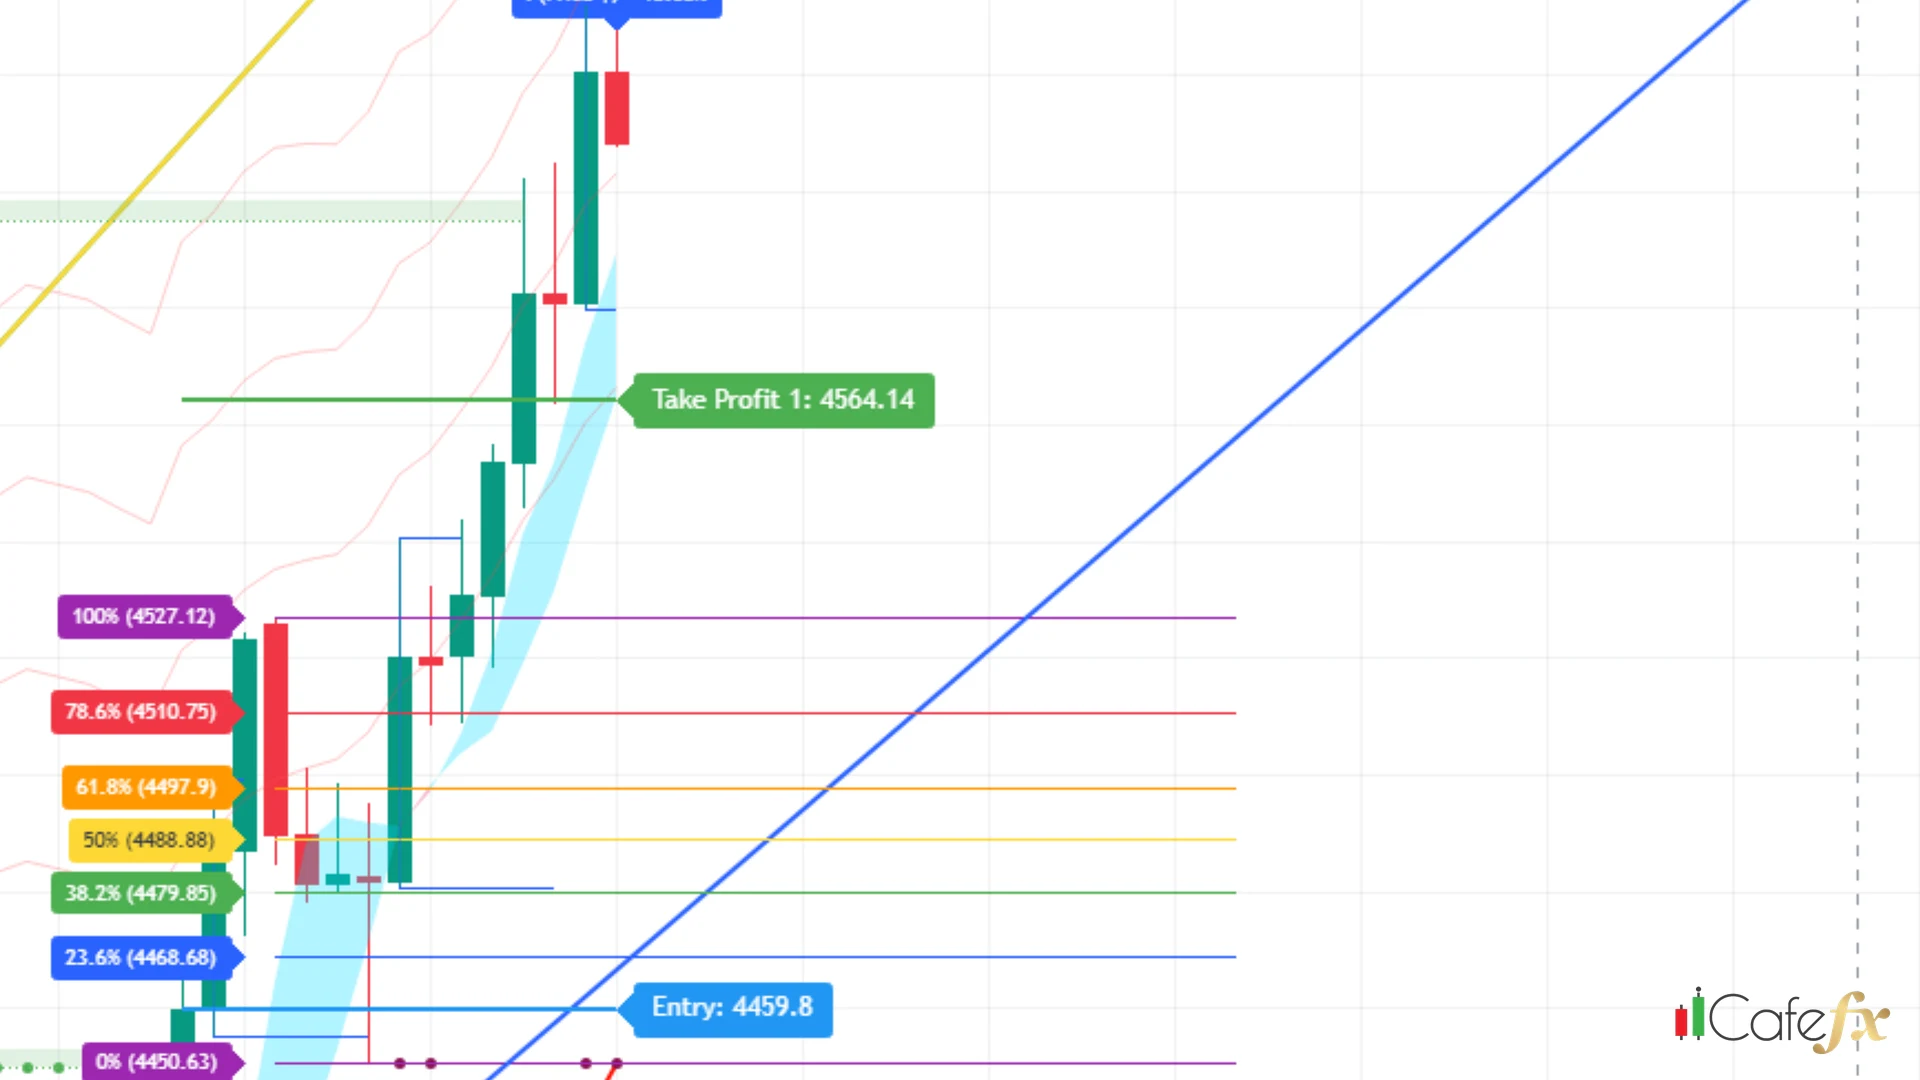
These three points sit close together but are not the same thing — read the labels carefully before you decide
3 · How the SL is calculated
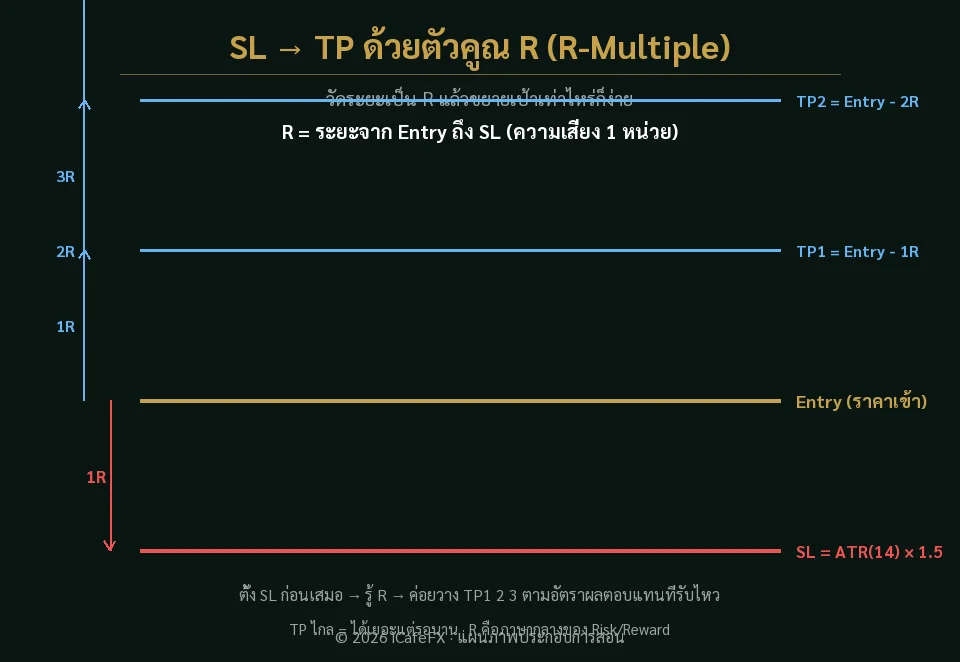
SL = ATR(14)×1.5 — one fixed formula, the same for every pair on every timeframe — ATR is the average price movement of the last 14 candles; multiply it by 1.5 and you get the SL distance
The SL does not change from pair to pair — every pair uses the same simple ATR×1.5 formula, easy to remember
4 · Auto-Detect does not change the SL
The chart has an Auto-Detect option that looks like it adjusts the SL automatically by pair — but in reality it does nothing; it is old code that no longer works, and the SL remains ATR×1.5 as always
Auto-Detect is dead code, it does not change the SL — do not be misled into thinking it adjusts anything for you
5 · TP1/2/3
TP comes in 3 levels = 1R · 2R · 3R — R is the SL distance (R = ATR×1.5), so TP1 = 1× the SL distance, TP2 = 2×, TP3 = 3×; the farther out, the bigger the reward, but the harder it is to reach
6 · Honesty matters most
Every Entry/SL/TP value is a per-timeframe estimate, not a number that stays valid forever — it must be used together with confluence (Fib + Elliott + Gold Meter + Dashboard) before you decide to enter
- Look — at the Entry/SL/TP that Redhat has drawn
- Check — whether the confluence is ready
- Then enter — Entry/SL/TP are estimates, not a 100-percent forecast
"Entry/SL/TP are estimates — use them together with confluence"
This chapter in one line
Entry = the close of the reversal candle, SL = fixed ATR×1.5, TP = 1R/2R/3R, Auto-Detect is dead code — all of it is an estimate, to be used with confluence