PART 1 · Basics
Reading the Market: Structure + Candlesticks
Before using any tool, learn to read the market itself. This chapter gathers every essential in one place — market structure (trend / range / Support-Resistance / BOS-CHoCH) and candlestick reading (body / wick / key patterns). Finish it and the Redhat chart will tell you what the market is doing.
Chapter videos
Real screen-recorded charts · not investment advice
TL;DR
Markets move in only 2 modes — a trend (a staircase in one direction) or a range (a ball bouncing inside a room with floor and ceiling). Read it from swing highs and lows; when structure breaks (BOS/CHoCH) the direction may flip. Candlesticks are the market's language — the body shows who won, the wick shows who got pushed back, and key candles (Engulfing, Pin Bar) flag reversal timing.
1 · What is a trend: read it from swing highs and lows
A trend is the direction price is travelling. Read it from the successive highs and lows price prints — never from a single candle.
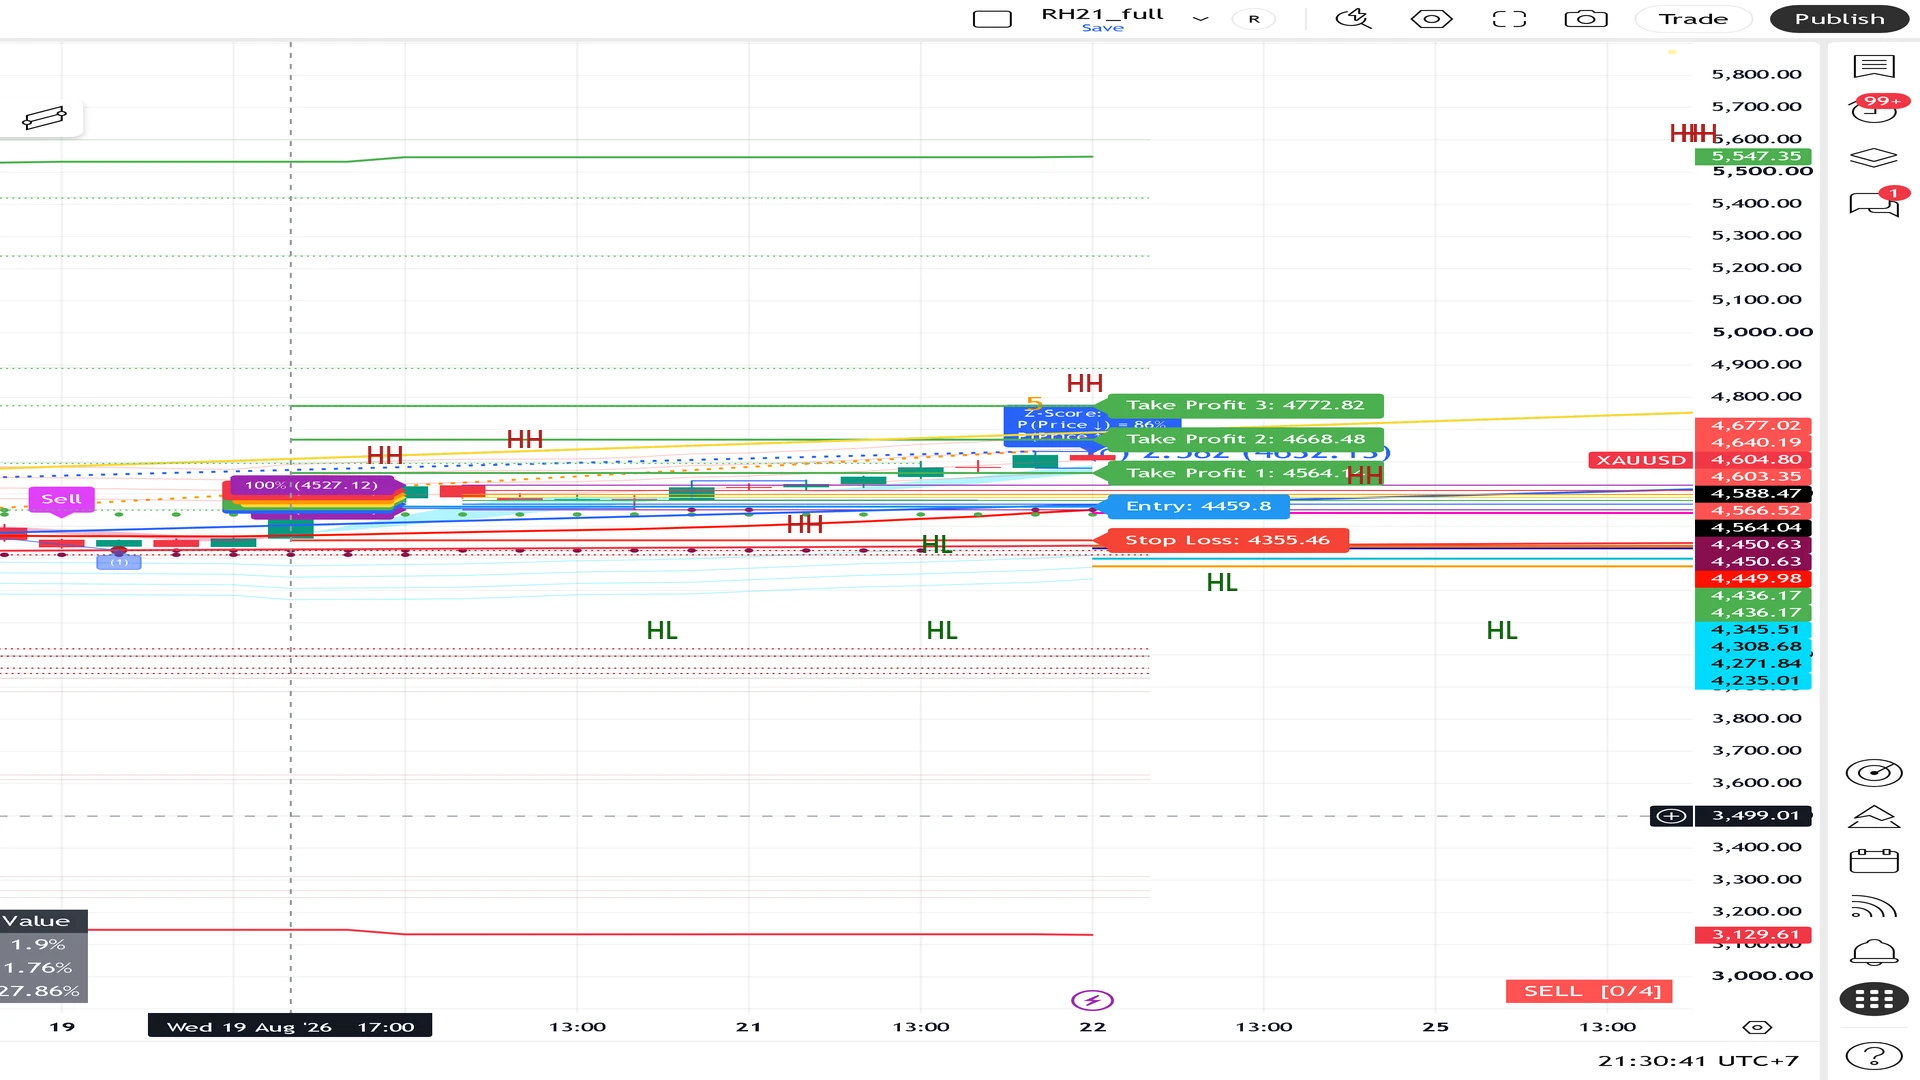
- Uptrend — each high higher than the last (Higher High, HH) and each low higher too (Higher Low, HL): a staircase up.
- Downtrend — each low lower (Lower Low, LL) and each high lower too (Lower High, LH): a staircase down.

A swing point is a "clear peak or trough", not every candle — take the obvious turning points, line them up, and if they climb it is an uptrend. Do not fight it.
2 · Sideways ranges: price going nowhere
Sometimes price goes nowhere — highs and lows line up horizontally, same ceiling, same floor, repeating. That is a Sideways range.
Inside a range, buying at the ceiling or selling at the floor usually hurts — price smacks the ceiling and falls, taps the floor and bounces, until one side finally breaks out.
Trend = a staircase in one direction · Range = a ball bouncing in a room with a floor and a ceiling — identify which one you are in before choosing how to play.
"Before entering a trade, ask: is the market climbing a staircase or bouncing in a room? The answer changes everything about how you trade it."
3 · Support and Resistance
Support = a floor where price has fallen and "bounced up" several times — a zone where buyers wait.
Resistance = a ceiling where price has risen and "turned down" several times — a zone where sellers wait.
- The more times price bounces/falls at the same zone, the more significant that zone is
- Once price breaks through a ceiling, the old ceiling often becomes the new floor (Role Reversal)
- On a Redhat chart these are the places where Fib, liquidity zones and swing points tend to stack — the more they stack, the stronger the zone
Draw a horizontal line through the highs/lows price has hit repeatedly — not every candle, just 2-3 clear bounce points.
4 · Structure changes: BOS / CHoCH (in plain words)
When price breaks a previous high or low, the old structure is broken and the direction may change. Two names, one idea:
- BOS (Break of Structure) — price breaks the old high/low in the same direction = trend continues. An uptrend punching a new high is still an uptrend.
- CHoCH (Change of Character) — price breaks the old high/low against the prior direction = direction may flip. In a downtrend, price breaking above the previous high may start an uptrend.
A real break must close beyond the old level — not just poke through and fall back. Wait for candle close confirmation, then cross-check the other Redhat tools.
5 · What a candlestick is: body and wick
One candle comes from the open · high · low · close of one time interval (e.g. M15 = 15 minutes). Two parts matter:
- Body = the span between open and close — a big body means price moved with conviction, a small body means hesitation.
- Wick / Tail = the lines above and below showing how far price travelled and got rejected — a long wick means price was pushed back.
Green body = close above open (buyers won) · red body = close below open (sellers won) — colour shows the candle's winner, the wick shows who got shoved back.
6 · The 2 key candles worth memorising
Don't memorise twenty patterns — these two appear often and read easily:
- Engulfing — a new candle bigger than the last, swallowing it whole in the opposite colour = the old side lost to the new side; a reversal signal.
- Pin Bar — small body, long wick on one side = price travelled far and got pushed back; the wick points opposite to where price goes next.
A key candle is only a "wake-up call" — check the location too: is it at an important zone, did a Redhat signal print there, before deciding for real.
7 · Liquidity zones, first look
A question newcomers rarely ask but should: "Where is everyone else's money sitting?" — the answer is: where the crowd parks its stop losses. When price reaches them, all those orders fire at once and price sprints. That is a "liquidity sweep".
Clear old highs/lows (stops waiting there) · freshly formed swing points · round-number levels — price often taps them first before continuing. Full treatment in Chapter 5.
8 · Combine everything to confirm Redhat signals
Redhat tools answer "where · which way"; structure + candlesticks answer "exactly when to enter". Pair them and you enter with far more confidence than blindly following a signal.
Structure and candlesticks are not fortune tellers — they are "the language the market speaks in that moment". Use them to confirm, not to replace signals, and every read is an estimate, never a guarantee.
This chapter in one line
Read highs and lows to know the direction (trend/range) · know the floor and ceiling (Support/Resistance) · time it with candlesticks — with these you are ready for the measuring tools in the next chapters.