PART 1 · Fundamentals
Reading Price Action with Redhat
Candlesticks tell the story of the market — each candle is the fight between buyers and sellers within one time window. This chapter teaches how to read bodies and wicks on a Redhat screen with the system running, the 2 key candle types used most often, a first look at liquidity zones, and how to use Price Action to confirm Redhat signals with more confidence
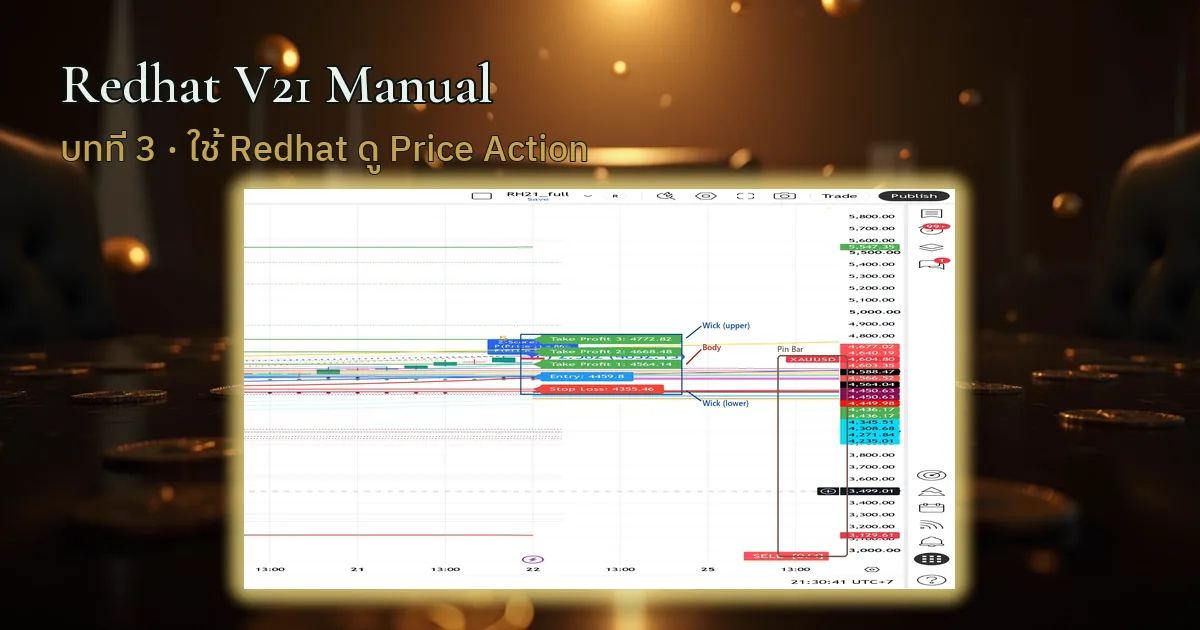
Chapter summary video
Real chart screen recording · not investment advice
Listen to the TL;DR summary of this chapter
TL;DR
Price Action = reading raw candlesticks — the body shows how far apart open and close are, the wick shows where price was pushed before it came back. Key candles (Engulfing, Pin Bar) flag reversal timing, and liquidity zones = the places price loves to sweep
1 · What is a candlestick: body and wick
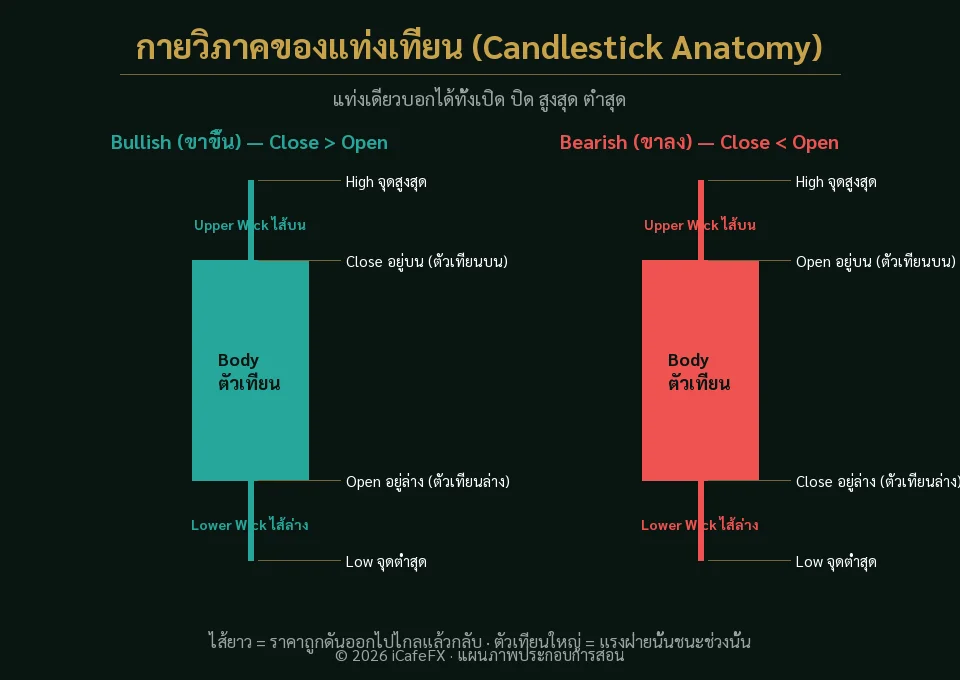
One candlestick is built from the open · high · low · close prices of one time window (e.g. M15 = 15 minutes). There are 2 parts to know:
- Body = the gap between the open price and the close price — a big body = price moved a lot, a small body = price hesitated
- Wick / Tail = the lines above and below that show how far price ran to the high/low before closing back — a long wick = price was pushed back

A green body = close higher than open (buyers strong) · a red body = close lower than open (sellers strong) — the color tells you who won that candle, the wick tells you who got pushed back
2 · The 2 key candle types used most
No need to memorize lots of candles — only 2 types are worth remembering because they show up often and are easy to read:
- Engulfing — the new candle has a bigger body than the last one and swallows it whole, in the opposite color = the old side lost to the new side, a reversal signal
- Pin Bar (long wick) — a small body with a long wick on one side = price went far and was pushed back; the wick points opposite to the direction price will take

A key candle is only an "alert voice" — check the location too: is it at an important zone, does a Redhat signal fire there, before making a real decision
"Candlesticks are the language of the market — reading just the 2 important types well beats memorizing twenty you cannot read"
3 · Liquidity zones intro (setting up chapter 6)
There is a question newcomers rarely ask even though it matters: "where is other people's money sitting?" — the answer is the points where lots of traders park their stop losses
A stop loss is the order "if price reaches this point, exit the trade" — when price gets there all those orders fire at once and price shoots ahead, which is called a "liquidity sweep" (Liquidity Sweep)
Clear previous highs/lows (where stops wait) · freshly printed swing points · round-number levels — price usually taps them first and then moves on. Chapter 6 covers this in full
4 · Using Price Action to confirm Redhat signals
Redhat tools tell you "where · which direction", while Price Action tells you "which moment is worth entering" — pairing the two is more reliable than entering on a bare signal
Price Action is not a future-predicting tool — it is "the language the market speaks in that moment". Use it to confirm, not to replace signals, and every read is a projection with no guarantee
This chapter in one line
Read candlesticks raw — bodies and wicks show the winner, key candles show reversal timing, and knowing where price loves to sweep = tighter confirmation of Redhat signals